Jump to: Annual Report | Trend Reports | Comparison Reports
Telling Your Story with Data
After you enter your data each year into a Cultural Data Profile (CDP), that data is available to you in the form of pre-formatted analytic reports that allow you to track your trends in performance and benchmark your organization against others in the field. When making the case for your organization, numbers tell a powerful story. Annual, trend, and comparison reports are designed to help you articulate your strengths, assets, challenges, and opportunities. They have been used effectively in board meetings, donor cultivation, marketing efforts, and more, for simple messaging and in-depth analysis.
Annual Report: An overview of up to 3 years of CDP survey data Run an Annual Report | Watch a Video with Instructions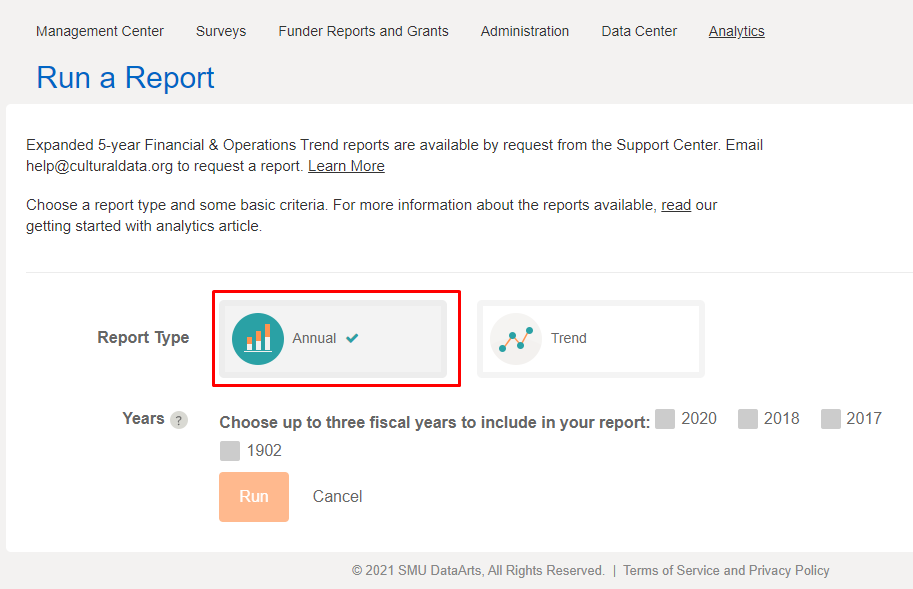
The Annual Report provides a high-level snapshot of your financial and programmatic activity, including workforce and attendance details, showing up to a three-year trend. Use it to orient new staff and board members, and to introduce prospective donors and grantmakers to your organization.
Ideas for using your annual report:
- Plan for the future: The report is a great starting point for thinking systemically about your organization’s past and future. Use the report in staff meetings to plan for the coming year.
- Distribute to your board: Include the annual report in your board book. This report serves as a summary of the previous two years’ finances. It allows your board members to evaluate past performance in order to inform future decision-making.
- Post to your website: Upload the annual report to your website to illustrate your organization’s financial and programmatic activity. The report can also be included in a media kit.
- Share with prospective donors: Bring a copy of the annual report to meetings with prospective donors.
- Submit with progress reports: Include the annual report with other required materials that you send to grantmakers as part of an interim or final report. This report can help define your organization’s needs and illustrate your financial health.
Trend Reports: Compare 3 years of data in 6 trend reports
Run a Trend Report | Watch a Video with Instruction
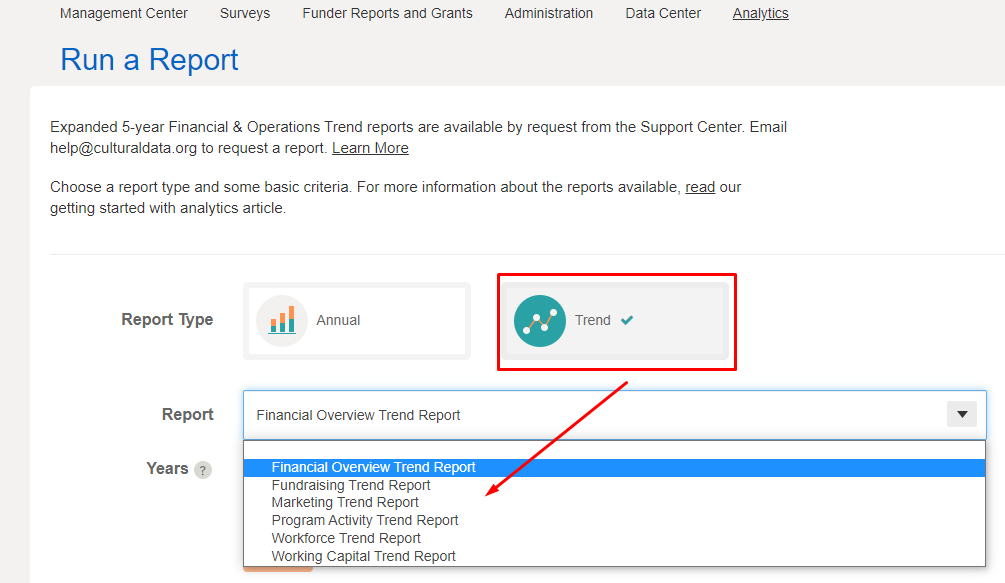
Financial Overview Report: Analyze your Revenue, Spending, and Balance sheet to learn about your organization and inform planning.
The Financial Overview combines data tables and colorful charts to highlight key aspects of your operating activity and financial health. Use the report as a financial check-up on recent trends and changes in your overall business model, spending, and working capital. Share the report with your treasurer, finance committee, and full board to inform your decisions and planning.
Fundraising Trend Report: Compares contributed revenue to fundraising expenses and includes details about contributors
Questions to consider:
- Do your fundraising efforts have a significant impact on your contributions?
- Are you relying on the same sources of funding from year to year? How reliable is each funding source?
- How do your fundraising efficiency metrics compare to those of other organizations?
Marketing Trend Report: Compares marketing activity, mailings and social media, and attendance across selected fiscal years
Questions to consider:
- What are all of the ways to describe participation at your organization?
- Are there any one-time events that make the numbers look skewed?
- Are your program offerings reaching enough people? Are your attendance numbers where you want them to be?
Program Activity Trend Report: summary attendance, program activity, and pricing
Questions to consider:
- Have ticket prices and marketing efforts affected our attendance?
- Are there any one-time events that make our numbers look skewed?
- Are my program offerings reaching enough people? Are my attendance numbers where I want them to be?
Workforce Trend Report: full-time, part-time, permanent, volunteers, and board member numbers, as well as, personnel expenses, artists, and contractors’ detail
Questions to consider:
- If your organization has seasonality, what else changes at your organization as your staff size grows or shrinks?
- How hard or easy is it for participants to access your programs? Are your program spaces situated close to where your audience lives? Close to public transit?
- If you were to increase your programming, at what point would you require additional staff, and could your current office space accommodate additional workers?
Working Capital Report: helps you assess your organization’s strength sand needs and determine whether your organization can fulfill its mission, withstand risk, and weather the financial impact of unforeseen circumstances. It is the key to determining your ongoing sustainability.
Questions to consider:
- How much is your organization relying on in-kind contributions to operate?
- Are your revenue streams fairly consistent from year to year, or does your revenue have a multi-year cycle or an even more variable pattern?
- How do you use your revenue trends to plan for the future?
Comparison Reports: Compare your organization's data to other organizations' dataRun a Comparison Report | Watch a Video with Instructions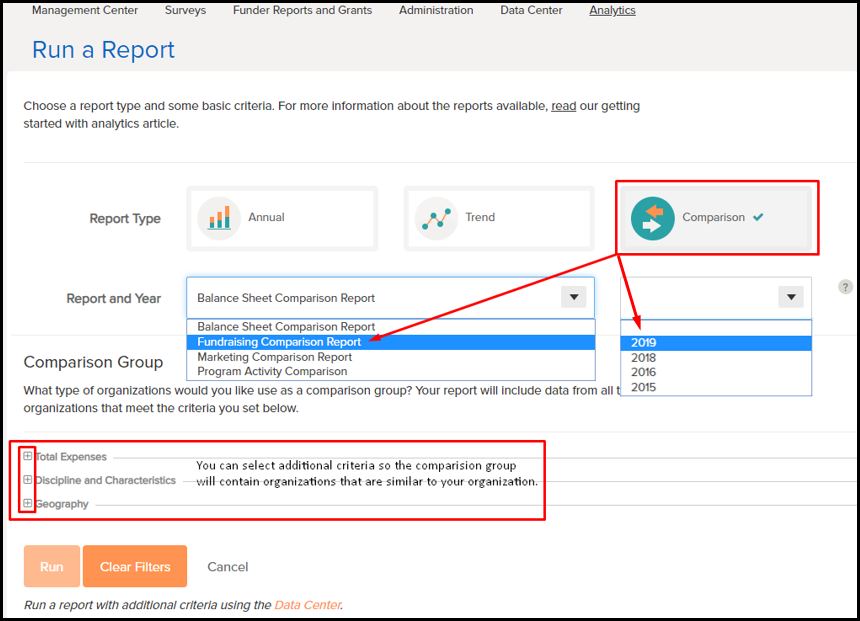
Comparison Reports: These reports compare your organization with a pool of organizations that you create by selecting criteria. This is a useful tool for benchmarking your data against other organizations using the data entered into your CDP surveys. The comparison group will always contain 3 or more organizations, if you can’t run the report, it may be because too few organizations are in your comparison group. Change the criteria to include more organizations.
Average and Median columns: The data for your comparison group will display in two columns: Average and Median. The average is the sum of all values of your comparison group divided by the number of organizations in the comparison group. The Median column shows the median value for each line item. The median is the mid-point in a series of numbers, where half the numbers are above the median and half are below the median. SMU DataArts offers both average and median calculations. The mean (average) is sensitive to extreme high and low values when the comparison group is small. Medians are less sensitive to extreme values and are generally a better indicator of central tendency for smaller comparison groups.
Financial Activity Comparison Report
Compare your organization's revenue, spending, and balance sheet data to a pool of organizations based on criteria you select.
Fundraising Comparison Report
The Fundraising report allows you to examine your fundraising activity and to analyze the return on investment of your fundraising expenses. The report highlights the number of contributors and calculates average contributions by donor type, and includes key fundraising metrics that allow you to analyze your fundraising efficiency and learn how much it costs to raise each contributed dollar.
Marketing Activity Comparison Report
The Marketing report allows you to examine your expenses associated with marketing as well as their impact on your program revenue and attendance.
Workforce Comparison Report
This report focuses on full-time, part-time, permanent, volunteers, and board member numbers, as well as, personnel expenses, artists, and contractors’ detail. It includes expense detail for W2 employees, contractors, and professional fees.
Working Capitol Comparison Report
Compare your organization's current assets and liabilities, and working capitol data to a pool of organizations based on criteria you select.
