Why use the Data Center?
Once you enter your data into the Cultural Data Profile (CDP), you are able to use that data in our analytic reporting tools. Our suite of trend reports track your performance trends over a period of time. Our comparison reports allow you to benchmark your organization against a pool of organizations. These pools are customizable by location, total expenses, and discipline. You can access reports from the Analytics section of the DataArts platform. If you want to take a deeper dive into comparison reports, consider running a report from the Data Center.
There are currently four comparison reports available from the Data Center:
- Balance Sheet
- Fundraising
- Marketing
- Program Activity
Through the Data Center, you can customize your comparison pools even further by using filters. In addition to size, discipline, and location, the Data Center allows you to filter by an organization’s number of employees and whether the organization received an audit.
How do I use the Data Center?
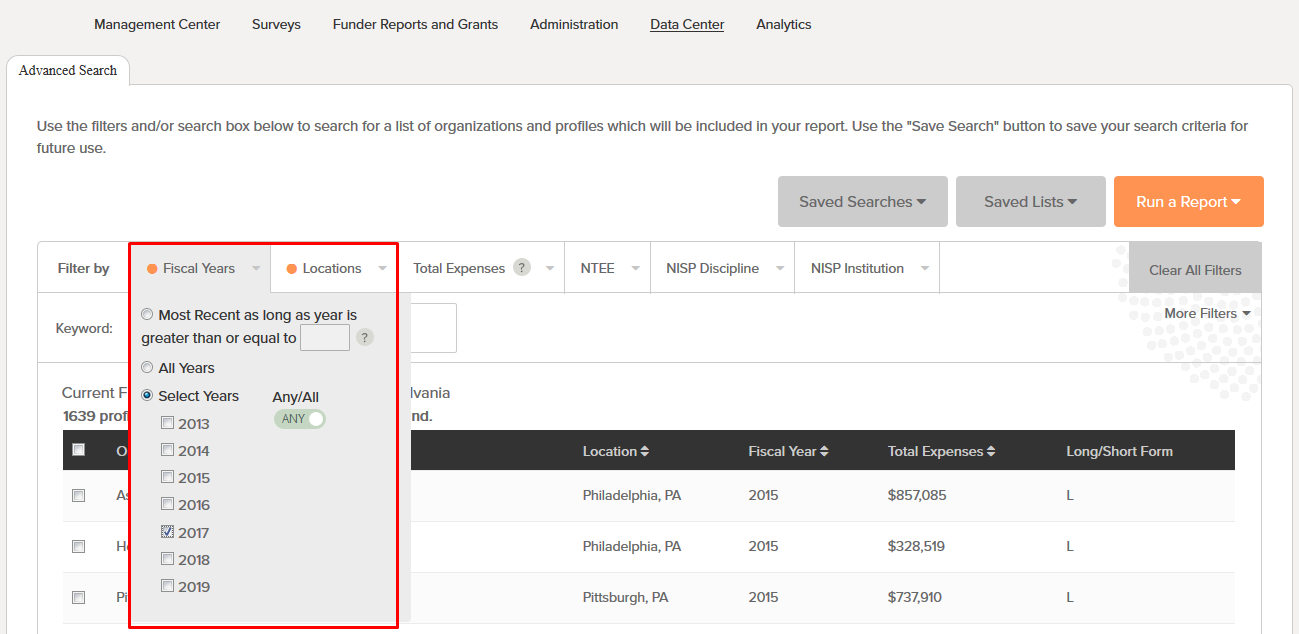
The Data Center filters automatically show you a default comparison pool of all organizations in your state who filled out a CDP. To create a comparison group for your benchmarking report, the first thing you will need to do is select a year. Click on the “Fiscal Years” filter and choose “Select Years.” Check the box for the year you’d like to run a report on. You may only select a year for which you have a completed CDP.
After you select a year, you can further customize your comparison pool by selecting additional filters. These will vary based on the question you would like to answer. You can filter by location at the State, County, City, or Zip Code level. To filter by organization size, you may use a number, or combination of filters: total reported expenses, whether an organization has filled out a long form or a short form CDP, and the number of fulltime employees as reported in their CDP.
To select organizations by discipline, you may filter by NTEE classification (codes used by the IRS) or by NISP disciplines and institution types. (For more on NTEE codes, refer to this article. See this link for information on NISP.) You may also choose to filter your comparison group by the DataArts Taxonomy categories which roll up NTEE and NISP classifications into larger groups: Performing Arts; Broadcast, Media & Literary Arts; Collecting Curating & Exhibiting; Community; Education; and Support & Advocacy.
Your comparison group must include at least three organizations in order to maintain privacy.
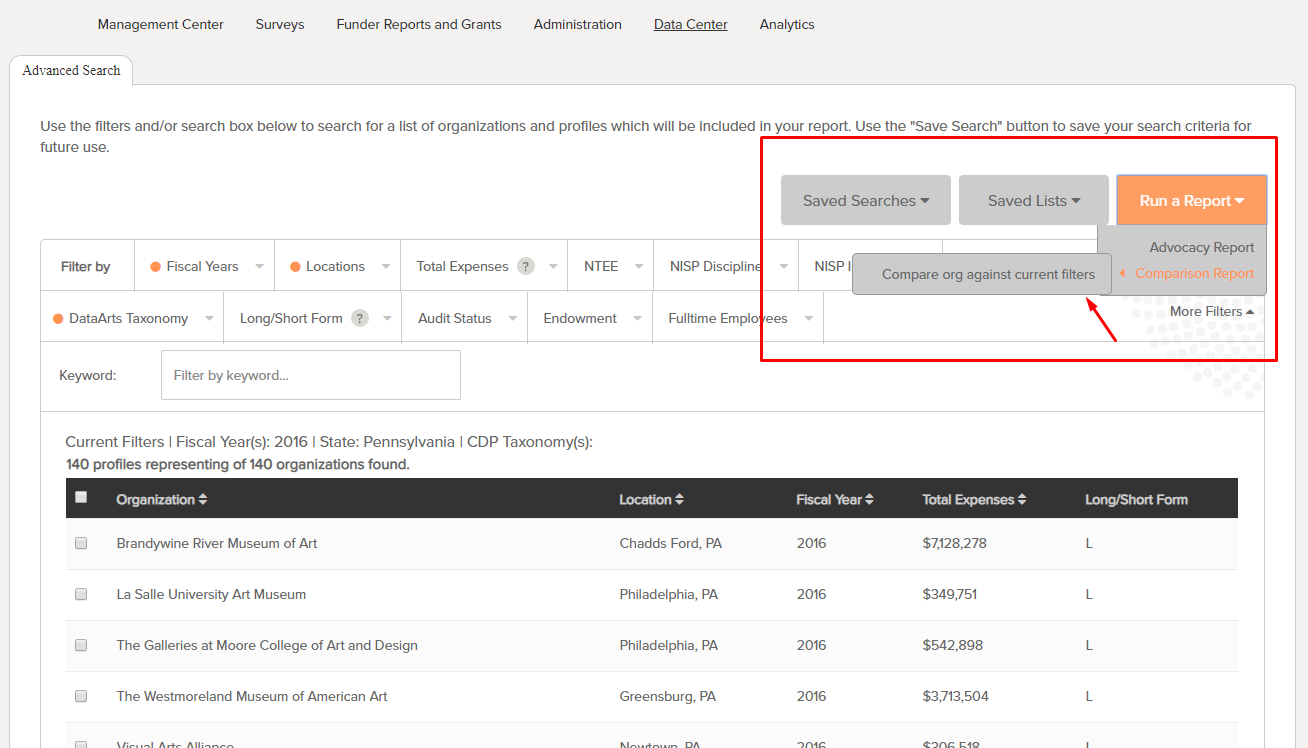
Once you have created your comparison group, click the orange “Run a Report” button. Hover over “Comparison Report” and click on “Compare org against current filters.”
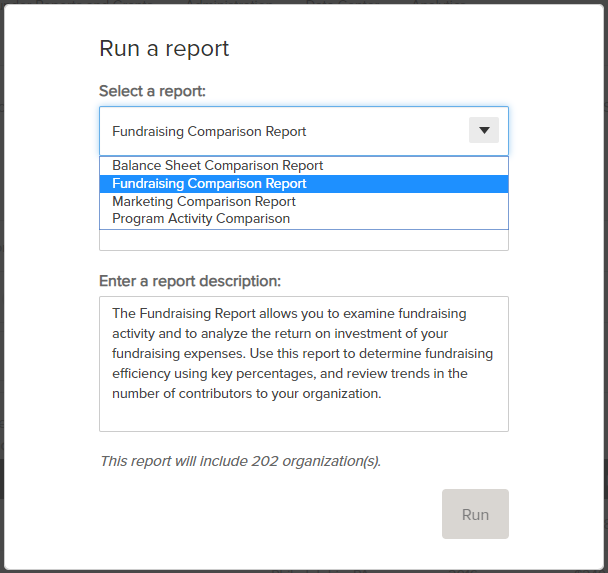
Select the type of report you’d like to run from the drop-down and enter a title for your report. You may edit the report description if you wish, before clicking “Run.” After the report generates, you’ll have the option to open or download a PDF version of the report.
You may run as many reports as you like, and you do not need to wait for one report to generate before running another.
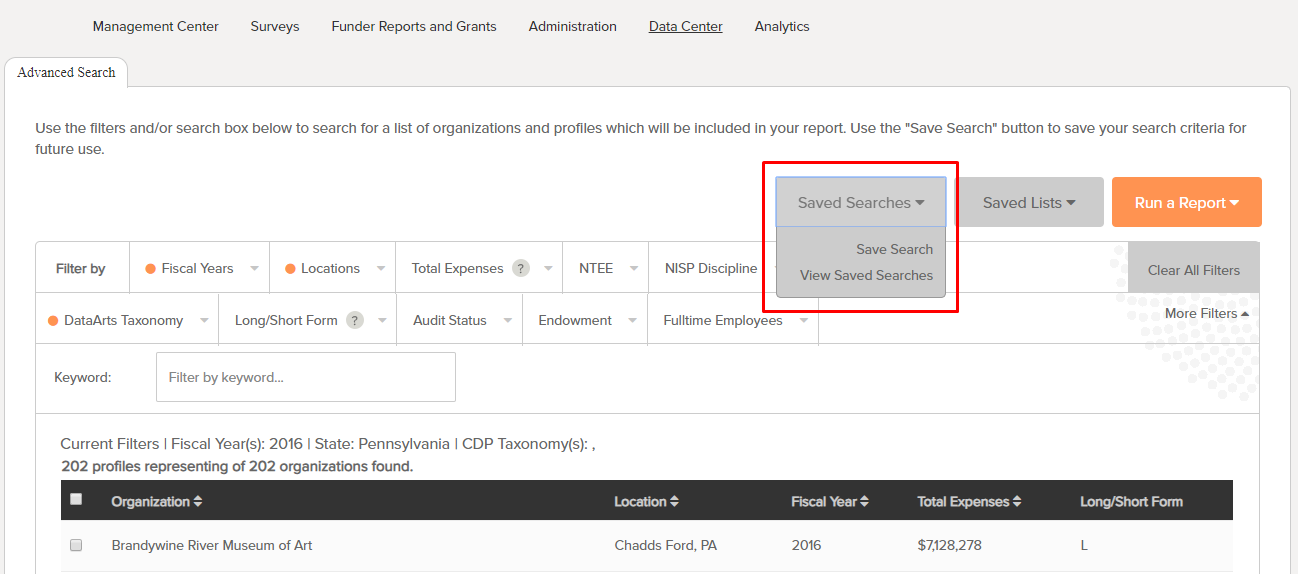
Once you have created a comparison pool you find useful, you may want to save it as a Saved Search. Click on the Saved Searches button and select “Save Search.” You’ll have the opportunity to name the pool and return to it at any time.
Saved Lists allow you to save a list of individual CDPs for specific organizations. This feature is not currently available for use with our comparison analytic reports.Through the Data Center you can also run the Advocacy report. Effective immediately, our
Advocacy Report subscription is now available free of charge. This tool is designed to help you build a powerful, fact-based case that provides insights into the cultural workforce of your community, its economic impact, and its community impact. Data currently reflected in these reports communicates the pre-crisis story of the reach and impact of the arts, a reminder of their community contributions in addition to their critical role in bringing people together.
For more tools on Analytics see:
SMU DataArts Analytic Reports
How to Run a Comparison Report [video]
Data at Work: Introduction to DataArts Analytic tools [recorded webinar] 